
Microsoft PowerPoint is truly a jack-of-all-trades. We’ve already shown you how to easily create flashcards, build Jeopardy games, design timelines, and even create quizzes there. In this guide, you’ll learn how to create interactive maps in a variety of ways without having to draw them from scratch.
What Is an Interactive Map?
An interactive map is a digital, clickable map that typically displays geographic information. Unlike traditional static maps that only display fixed information, an interactive map allows you to click, zoom, or hover to see more detail. This makes it a dynamic tool for PowerPoint presentations and online courses, providing a way to explore data and geographic locations in greater detail.
When Should You Use Interactive Maps?
As interactive maps serve multiple purposes, they can be incredibly useful in a variety of settings for both educators and business professionals. Here are some use cases for a map:
- Classes. Teachers can use interactive maps in geography lessons. By clicking on different countries or regions, students can learn some additional facts, such as capitals, economies, or traditional cultures. In history classes, a map can, for instance, be used to show the progress of battles waged during World War II or the migration patterns of ancient civilizations.
- Corporate presentations. Global organizations can show where their offices, factories, or customers are located. For example, managers can see how many employees work in different states or how customers are distributed by region.
- Marketing reports. Instead of presenting spreadsheets or static charts, market analysts can visualize market penetration, competitive presence, and average income by country or state, enabling more targeted, location-specific marketing strategies.
The first method of creating interactive maps doesn’t require any pre-downloaded map templates or images. Everything you need to have at your fingertips is PowerPoint itself. However, locating “Maps” might not be entirely intuitive. Follow these step-by-step instructions to create an interactive map in PowerPoint:
1. First, open your PowerPoint presentation and click on the slide where you want a world map to appear.
2. Click on the Insert tab and select Chart from the toolbar ribbon. This will open a dialog box with all of the types of charts you can add (this works properly in different PowerPoint versions, including PowerPoint 365, PowerPoint 2021, and PowerPoint 2019).

3. Select Map in the list of charts, and then click OK.

4. You’ll see a world map inserted into the slide and an Excel spreadsheet pop-up in which you can enter the data you need (e.g., countries, states, provinces) and the color saturation for each map object on a numerical scale. The higher the number, the more saturated the color.

As an example, let’s try to map the countries around the globe with the largest population in mid-2022 (from Statista). To do this, enter the countries’ names and their populations:

Note: By default, a PowerPoint map has 12 rows for adding locations in an Excel spreadsheet. If you need to display more geographic objects, you can easily expand this limit to the number of locations you need. Our table has 21 rows, so we need to expand to 21.
5. To do that, click on Select Data in the Design tab. In the opened window, expand the number of countries to the required ones in the line “=Sheet1!$A$1:$B$[your number]” and click on OK.

6. Perfect! All the countries are displayed on the map and colored according to their populations.

7. Now you can add a map title. Click on Chart Title above the map and enter its name:

Perfect! The interactive map is ready.
How to Make a Color-Coded US Map in PowerPoint
In PowerPoint, when you select Map from the Charts section, the default setting displays a world map. However, you have the flexibility to focus on a more specific region.
For example, if you want to create a color-coded U.S. map on, let’s say, the number of automobile registrations in different states, you can easily narrow your map down to just this one country:
1. To do that, once the world map is inserted into your slide, go ahead and delete any filled-in lines that appear by default in the Excel pop-up.
2. Type in the names of U.S. states along with the corresponding numerical data. As you begin to enter the names of the U.S. states, PowerPoint will recognize that your focus is on a single country and will automatically adjust to display a map solely of the United States.

3. Don’t forget to expand the number of rows to the number you need. We’re going to display 35 U.S. states, so we need to expand the number of rows to 36 (1 header row and 35 data rows). To do this, as we did in the previous example, click on Select Data, type “36,” and click on OK:

Fantastic! The color-coded U.S. map is ready:

How to Edit an Interactive Map
PowerPoint offers a range of customization options to tweak the appearance of your map, including changing the map layout and color palette. To do that, simply go to the Design tab on the PowerPoint ribbon and select the options you wish to modify:

By clicking on the “+” symbol located to the right of the map, you’ll reveal additional editing settings that enable you to display data directly on the map, add shadows, move the map legend, fill in the background, and more. For our example, we added some shadows and labeled the states to enhance the visual impact. Here’s the result:

How to Create an Interactive Map with PowerPoint and iSpring Suite
Sometimes you might need to add a map to your presentations very quickly and display a certain location in an interactive manner. Filling out Excel spreadsheets can take hours and is sometimes absolutely unnecessary. So, you may want to just insert the actual geographic map.
In this section, you’ll learn how to do that with a couple of clicks using iSpring Suite, the robust PowerPoint-based authoring tool:
1. To begin, download iSpring Suite. The software has a 14-day free trial, so you can explore its features without any commitment. Simply install it on your computer to get started.
2. Once the software is installed, the iSpring Suite tab automatically appears in the PowerPoint ribbon.
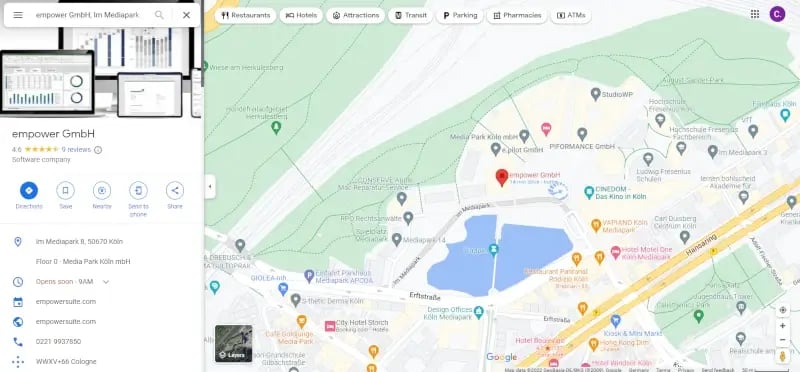
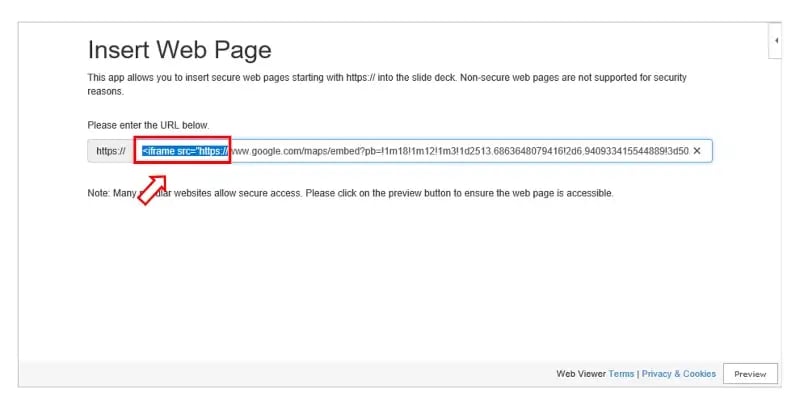
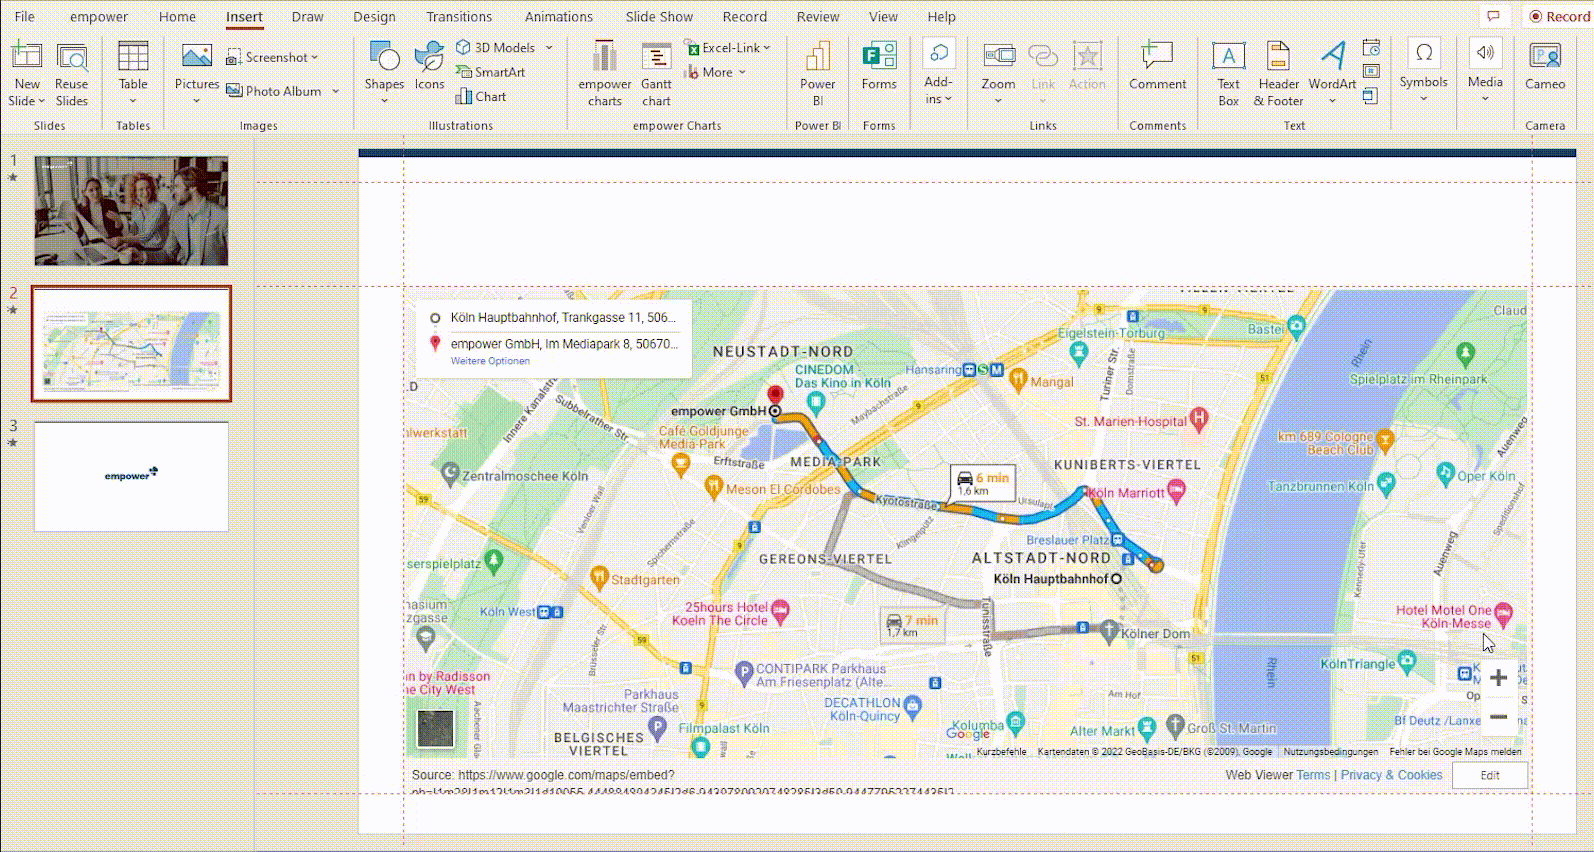
3. Select a PowerPoint presentation slide to which you want to add a map and click on the Web Object button in the Insert section. This option allows you to insert any web page, whether it is your website, an article, or a training manual published on the web. To display a geographic location, you can insert a Google Map.

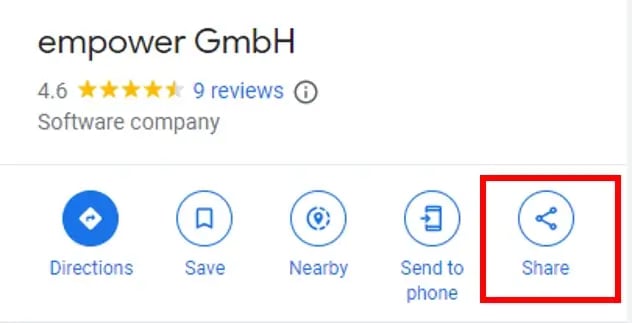
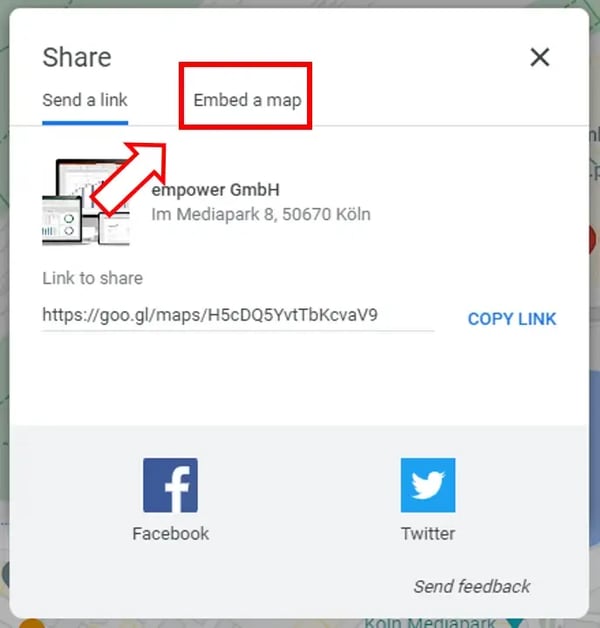
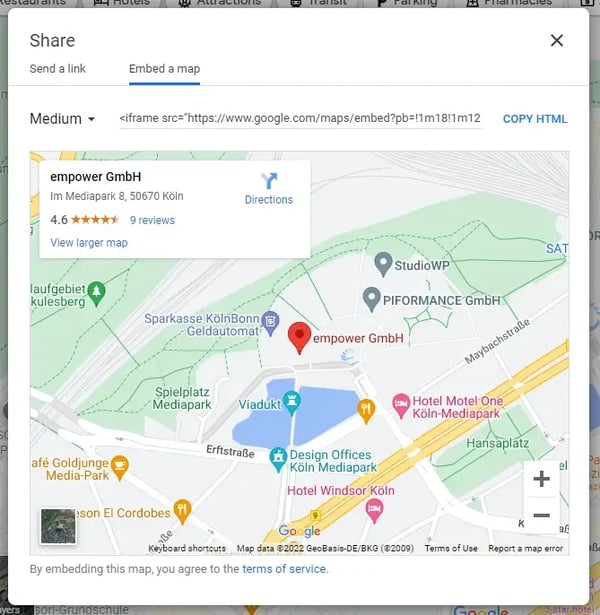
4. Go to the Google Maps website and find a specific location you want to display on your map. Press the Share button → Embed a map → and click on Copy HTML.

5. Go back to your presentation. In the Insert Web Object window, select Embed code in the menu, insert the link, and click OK.

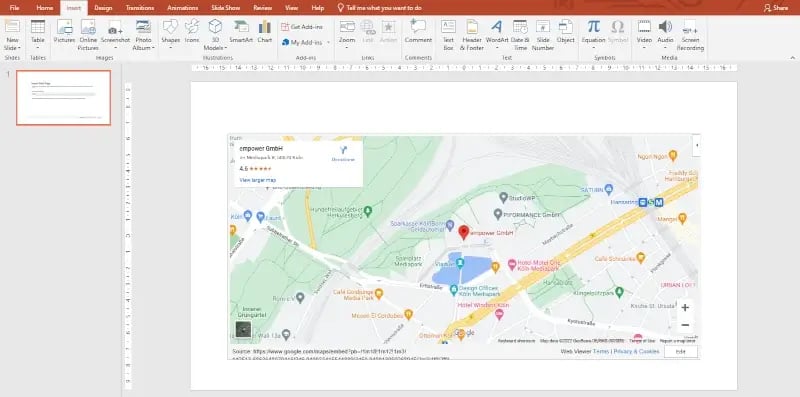
6. In the iSpring Suite tab, select Preview → Preview from This Slide to see the map.

Done! You’ve embedded the New York map in your presentation. Now you can zoom in, zoom out, and interact with the map to showcase specific boroughs and landmarks as needed.
How to Visually Enhance an Interactive Map
With iSpring Suite, you can not only embed a map, but also add different backgrounds to create a more immersive atmosphere.
1. To do that, click on Backgrounds in the Content Library section on the iSpring Suite tab. There you’ll find lots of locations, from devices to office settings and school environments.
2. In the opened window, select an appropriate background and click on Insert.

3. After you’ve inserted the background, right-click on it and click on Send to Back → Send Backward.
4. Adjust the size of your web object to the size of the whiteboard:

5. Perfect! Now it looks like an actual geography class. To add a personal touch, let’s insert a teacher. Click on Characters in the Content Library section and choose an appropriate one from thousands of real-life or illustrated characters:

6. Then press the Add to Slide button and click on Preview to see the final result.

Great! To publish the entire presentation, click on Publish in the iSpring Suite tab on the PowerPoint ribbon. If you want to publish your PowerPoint presentation online, select My Computer in the drop-down menu on the left pane. If you want to distribute your slides via an LMS as a SCORM file, click on LMS, then click on Publish.

An Alternative Way to Create Interactive Maps with iSpring Suite
In addition to inserting a real geographic map into your PowerPoint slide, iSpring Suite offers another possibility to create interactive maps with a Hotspot interaction. All you need to do is add an image to your PowerPoint slide and draw spots on it that will be highlighted when the mouse passes over them. You can add a description to each region and choose its shape and color.
This allows you to create a map of any location and add a description to provinces, landmarks, or important cities, as in this example of a map of the United Kingdom:

While we often associate interactive maps with geographic data, the term actually extends far beyond that. With iSpring Suite, you can make any static image dynamic.
For example, you could create anatomy diagrams to enhance medical or educational PowerPoint presentations about the human body. Alternatively, you might design a comprehensive infographic, wherein each point reveals additional facts when clicked. You could also display artwork, allowing viewers to explore different parts of a famous painting to learn more about the art, its history, or the techniques used. The possibilities are endless!
See how you can easily present the parts of an object, such as a vacuum cleaner:

Also read: How to Create a Hotspot Question for an Online Quiz
Template: Interactive Map in PowerPoint
If you don’t want to deal with Excel spreadsheets, multiple data entries, or downloading additional software, we’ve created an interactive world map template that you can easily customize for any purpose or situation. Just download it, place the pins where you want them, and your map is ready to go.
Download an Interactive Map Template →
FAQ on Interactive Maps in PowerPoint
1. What are the limitations of PPT when creating interactive maps?
First, PowerPoint doesn’t allow you to display multiple types of regions simultaneously. For example, you can’t showcase U.S. states and European countries on the same map. You must choose either countries or states or provinces. Attempting to mix different types of regions will result in an error message from PowerPoint.
It’s also not possible to add dots to represent cities automatically.
2. Do I need an internet connection to display an interactive map created with PowerPoint?
Yes. If your map relies on real-time data updates or external links, those specific features will require an internet connection to work properly. Additionally, if you’re using a feature that depends on Bing, Microsoft’s web search engine (via Insert → Charts → Map), then an Internet connection is also required to display the correct areas.
Alternatively, if you create a map with a hotspot interaction in iSpring Suite, it will be displayed perfectly even when offline.
To Sum Up
We hope you enjoyed this article and will explore one of the options mentioned above. If you find the methods for creating interactive maps using iSpring Suite compelling, go ahead and download the free 14-day trial to explore the tool’s capabilities firsthand.
Want a map in your PowerPoint? Go to ‘Insert’, pick ‘Maps’ under ‘Chart’ for a basic map. If you want a clickable map, grab the ‘Embed a map’ code from places like Google Maps, then in PowerPoint, hit ‘Get Add-ins’ and look for ‘web viewer’. Paste the code, and bam, you’ve got an interactive map!
Are you looking for an easy way to add a map to your PowerPoint presentation? This blog will discuss how to get up and running quickly with the necessary steps to insert a map. You can make your presentation stand out from the competition with just a few simple clicks. Let’s begin!
Method 1: Add a Map in PowerPoint Directly
You can add a map in the PowerPoint slide as a chart object. Here are the steps to do so:
1. Open the PowerPoint slide you want to add the map to.
2. Click on the Insert tab and select Chart from the ribbon toolbar. This will open a new window for you to choose your chart type.

3. Select Maps from the Charts section and then press Ok.
4. You will see a world map inserted in the slide. You can showcase data related to different countries from the pop-up excel sheet that opens within the slide. If you don’t want to add any data, simply close the excel sheet pop-up.

Note that this is a static image, and you cannot do much in terms of editing. However, it is a good option if you are looking to add maps to PowerPoint slides quickly.
Method 2: Add an Interactive Map in PowerPoint
If you want to add an interactive map in the PowerPoint to present a specific location, you can do so by using an Office Add-in.
1. First, go to the map’s website (Example: Google Map) you want to add in PowerPoint and find the specific location.
2. Press the share button that occurs under the tab of the place details. Then press “Embed a map”.

3. Copy the code from the box and save it for later. Now go to the PowerPoint slide where you want to add the map.
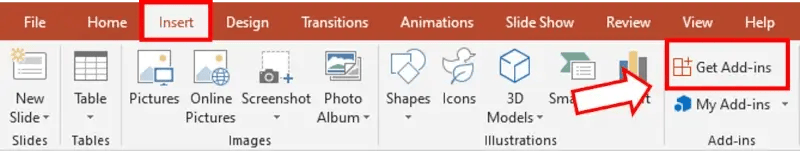
4. Click on the Insert tab and select Get Add-ins from the ribbon toolbar. This will open a new window for you to choose your add-in.
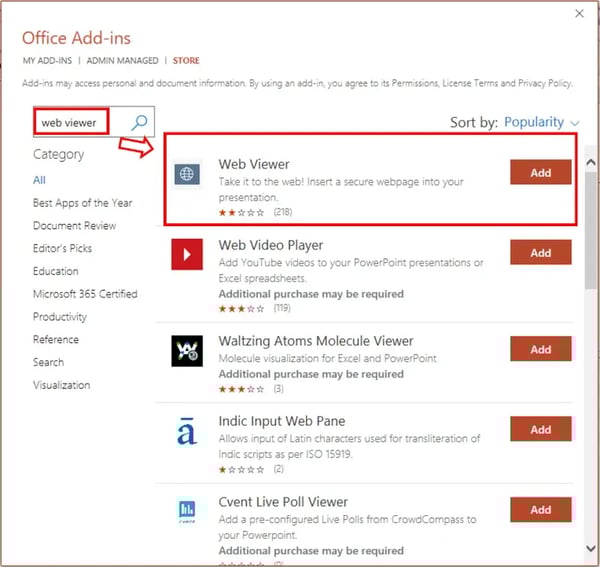
5. Search for web viewer and add the first add-in.

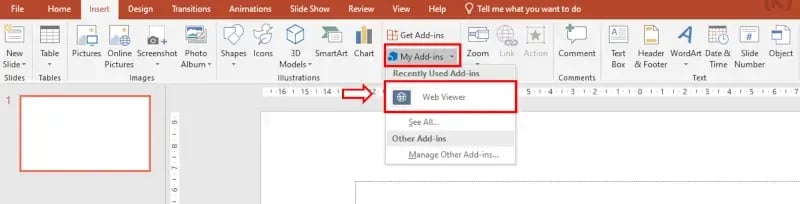
6. After installing the add-in, click on it from Insert> My Add-ins. A new window will open to paste the copied code of your map.
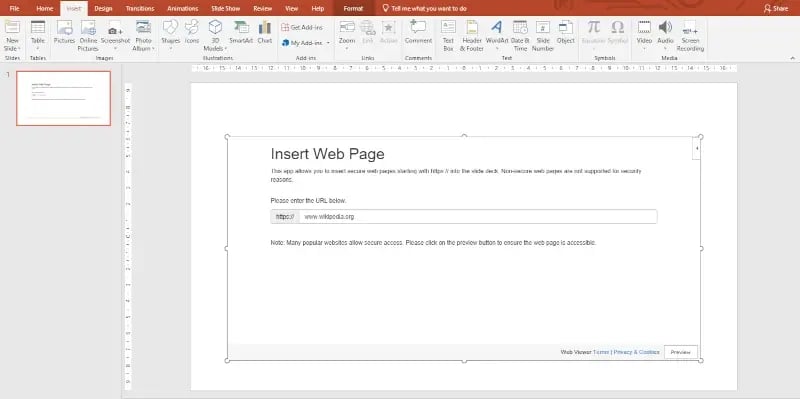
7. Paste the code after deleting the first part, including https:// from the beginning. And then press Ok.

8. You will see the map in your PowerPoint slide, which is now interactive.
Conclusion
Adding maps to PowerPoint slides is a great way to make your presentation stand out from the competition. You can either add a map in PowerPoint directly or use an Office Add-in to insert an interactive map. We hope this blog was helpful in understanding how to get started with adding maps in PowerPoint.
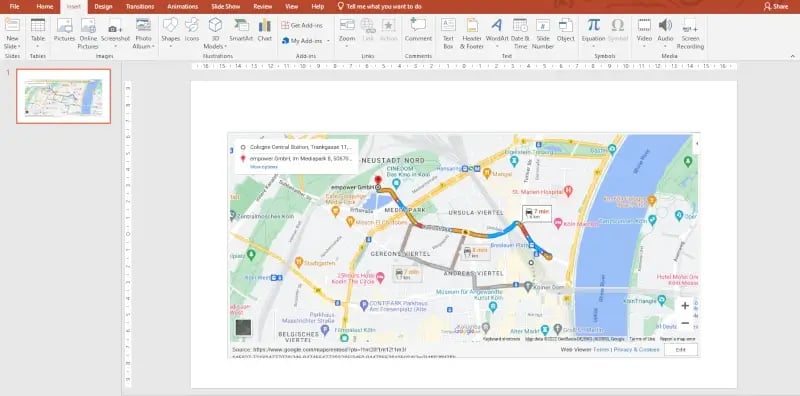
Google Maps snippets can easily be inserted into your PowerPoint presentation. For PowerPoint experts, the process can be summed up in 3 short steps. For non-professionals, we have created a detailed tutorial on how to insert an interactive map into PowerPoint.
The key to a successful presentation is interactivity. It keeps your audience attentive and increases the effectiveness of your presentation. The presenter view offers many possibilities for you to make the most of your presentation. In addition, you can impress your audience with unusual elements, including SmartArt, icons, and world maps.
An interactive map lets you show places and travel routes, and even see the street views together with your audience.
Inserting interactive maps or routes in PowerPoint – short version
- Copy the HTML link of your Google Maps route or map snippet.
- Add the “Web Viewer” add-in to your PowerPoint via the “Insert” tab.
- Use the Web Viewer add-in to paste the HTML link on a slide. Delete the beginning of the link up to and including https://.
Done! Your map is now in your PowerPoint presentation and you can interact with it!
How to insert an interactive map into a PowerPoint – instructions with pictures
In Google Maps:
- Select the location you would like to display in your presentation.

- Click “Share” in the box on the left side of the map.

- Switch to the “Embed” tab.

- Click “Copy HTML” to save the link to your clipboard.
Open your PowerPoint presentation:
- Select the slide that you want to add your map to and click on the “Insert” tab.
- Click “Get Add-Ins”.
- Enter the search term “Web Viewer” and select the very first result. The Web Viewer add-in is free.
- Now, click “My Add-ins” on the “Review” tab and select “Web Viewer”.
- The following screen will open in your presentation.
- Now, insert your copied HTML link. IMPORTANT: Go back to the beginning of the link and delete the first part up to and including “https://”.
- When you click “Preview” the map will open in your PowerPoint.
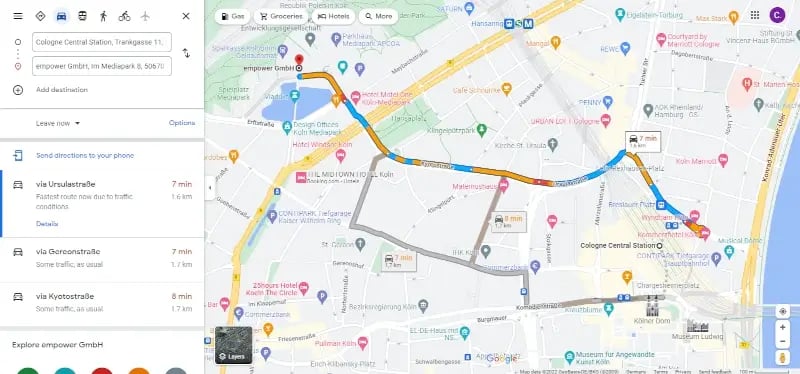
Insert interactive routes to your PowerPoint
Inserting routes to a presentation works essentially the same as inserting maps. Here are the differences:
- In Google Maps, find the route using the “Directions” feature.
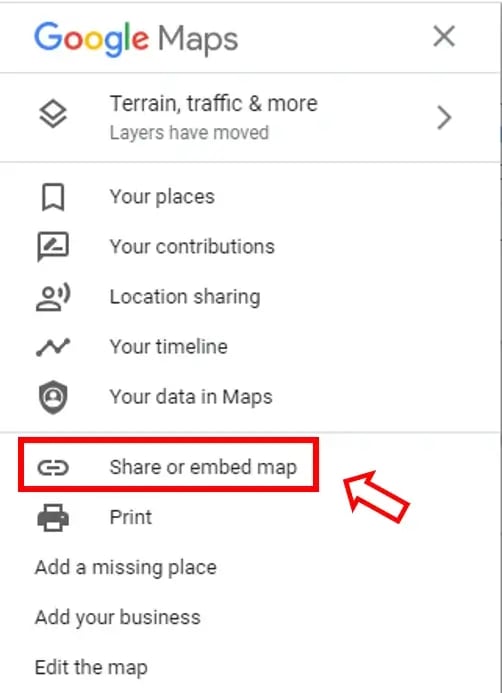
- Open the Google Maps menu by selecting the icon at the upper left. Click “Share or embed map” to copy the HTML for your route map.

- Insert the route map into your presentation using the same steps as inserting a simple map. This is how your route would look as an interactive map in PowerPoint.
- If you would like to update the route, for example, to check out the traffic situation, go to the Web Viewer settings menu in the upper right corner and click “Reload”.
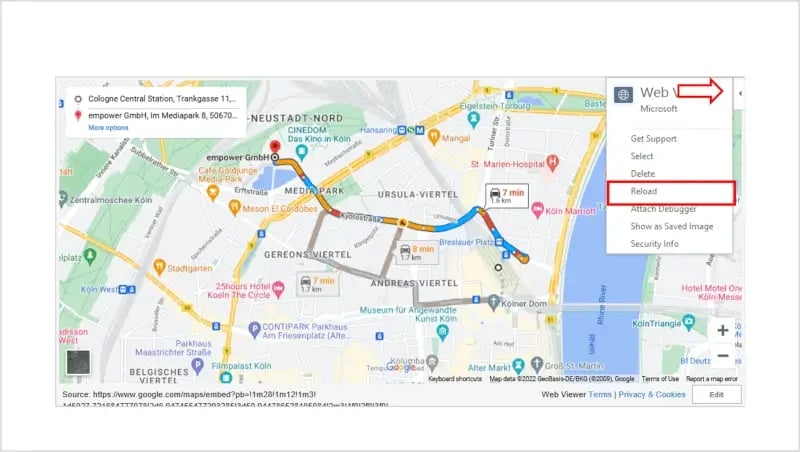
How interactive is the Google map embedded in your PowerPoint?
If you are connected to the Internet you can interact with the map just as you would in a browser. You can move the map area in your PowerPoint using your mouse. Just like in Google Maps, simply grab the map with the cursor and drag it in any direction. You can zoom in and out of the map using the “+” and “-“ signs at the bottom right of the map. The satellite view can be activated or deactivated by the small window in the lower left corner, also as directly in Google Maps.
You can also get information about other locations. If you click on locations in the map, you will see information about a particular café, restaurant, or other business or point of interest in the upper left corner instead of the route.
We hope this guide will help you design and present a successful, interactive PowerPoint. Are you curious about how to implement more, corporate design-adhering diagrams in your PowerPoint presentations? Have a look at empower® Chart Creation solution! Our PowerPoint add-in allows you to create elegant PowerPoint presentations and charts quickly and in your correct corporate design.
Contact us for more information on how to pave the road for your employees to increased efficiency when working in Office!

Want to know how to create a map in PowerPoint? Let’s explore some ways how to create a great map in PowerPoint.


Variety in presentations is a must. Don’t have the same presentation as everyone else. Added visuals in a presentation capture and keep the eye of your audience. Using US PowerPoint maps to add a sense of location to your presentation is one way to do this. But you probably don’t have time to draw maps from scratch in PowerPoint. And grabbing images of a map online might be inflexible or unlicensed for use.
In this tutorial, I’ll show you how to make a great map in PowerPoint. We’ll use a pre-built template. We’ll also look at some ways you could create an animated map in PowerPoint too.
How to Create Beautiful Maps in PowerPoint (Video)
Do you wonder how to create custom maps in PowerPoint? Wonder no more. The video below will give you the head start you need to add beautiful PowerPoint maps to your presentations.

Continue reading to find even more helpful tips for using maps for PowerPoint presentations.
How to Use PowerPoint Maps
PowerPoint is an extremely flexible app. Pair it with pre-built PowerPoint US map and world map PowerPoint templates. That’s even more powerful. For example, want to know how to create a US map in PowerPoint? The right template makes this a snap.
Here are some examples of how you could use PowerPoint maps for presentations:
- Company locations. Plot your company’s presence. It could be across the country or even across the globe. Try something like well-designed PowerPoint US map template. Or try a world map for PowerPoint.
- New markets to expand into. Highlight the territories that you’re prospecting. An illustrated PowerPoint map slide could be effective.
- Maps showing history. For example, link together a few locations on a map. This can show the various places you’ve lived over time in a personalized slide deck.


We’ll work with this Maps PowerPoint Infographic Slides deck in this tutorial.
I’ll show you how to take the template from Elements and customize it. We’ll easily create interactive maps in PowerPoint. Let’s learn more about slide customization.
How to Adjust PowerPoint Map Templates
In this tutorial, learn how to create a map for PowerPoint. We’ll change slides from the Maps PowerPoint Infographic Slides template. Check out the screenshot below. There are many slides inside this template. They depict a wide variety of geographies. If you want to know how to create a map in PowerPoint, it’s a perfect solution. There’s so much to choose from.
Remember, you’re just starting with a slide template. You don’t have to stick to that exact style. Any of these starter slides can be pulled from this template. Adjust them to your specific presentation preferences. They are ready to drop into a finished presentation.


Let’s walk through five visual adjustments that you can make to a map slide in PPT to customize them for your use. Then, I’ll show you how to move the slide to your existing deck.
1. Change the Gradient Overlay
The blue-green style in this template may not fit in with your existing slides. Luckily, it’s no problem to change these gradients to a different color.
For each of these modification examples, we’ve got to start by ungrouping the blocks. The author grouped all the individual states or provinces on the PowerPoint map charts. They’re in a single block. This makes it easy to move and adjust. To change specific parts, you’ll need to ungroup them.
To do that, right-click on a map in PPT and choose Group > Ungroup. This splits the PowerPoint map template chart out into many individual blocks that you can edit independently.


Once you ungroup the map, you can select the individual components. In the example below, I chose the main region at the top of the map. Then, I right-clicked and chose Format Object.
On the sidebar, you can choose the fill options, and change the colors in the Gradient Fill section. Just click on the arrows and change the colors in the paint bucket drop-down. In the example below, I’ve changed the arrows to shades of green.


2. Focus on a Single State
The maps in this template are far-reaching and often include an entire nation. When you want to focus on a rather specific part of the PowerPoint map, you might want to highlight a particular state and fade out the rest of the blocks.
Again, start by right-clicking the map and choosing Group > Ungroup. As a reminder, we do this so that we can select individual components of the map and adjust them individually.


After you’ve selected the regions you want to change, right-click and choose the format shape options. On the fill menu, turn up the Transparency slider to fade out the selected regions. You can leave them in the map view but fading them a bit brings more focus to the critical parts of the PowerPoint map.


3. Remove Regions as Needed
Just because the PowerPoint map features a broad region with many states or countries in it, that doesn’t mean that you’ve got to include all of them. You can select individual areas to remove.
In the example below, remember to start by clicking on the map and right-clicking, selecting Group > Ungroup.


Then, just click on each of the regions that you want to remove from the map. Press delete on your keyboard to remove all the selected areas.
One of my favorite things about the maps for presentations in this slide deck is that the shapes are of high quality, so you can resize them as needed. In my example, I’m going to remove several of the provinces in Belgium, and then scale up the remaining infographic.


4. Add a Border in PowerPoint for Focus
After you’ve ungrouped a block of areas in a PowerPoint map, you can work individually with the states on the map. Another change you can make is to add a border in your PowerPoint map to break out a single region of the map.
Again, start by ungrouping the map. Then, select a single region and right-click Format Shape.
On the new menu that opens, find the Line drop-down and click on it. Then, you can change the Color, transparency, and width to modify the presence of the map border as you can see in the screenshot below.


Try increasing the size of your border to focus on a single region. You can also change the color of that border to draw more attention to the specifics.
5. Add an Annotation
If you really want to highlight a specific part of the map, you might need to add an annotation. Annotations can draw attention to very specific parts of a slide.
My favorite way to add annotations is to use a shape. Go to the Insert tab on the PowerPoint ribbon and choose Shapes. Then, find a shape that can act as an eye-catching text box to add to the map.


Remember that if you’re pointing to specific cities or towns, you’ll want to be very careful that your annotations are accurate. Cross-reference the placement of an annotation with a much more detailed tool like Google Maps.
How to Insert a Map Slide Into Your PowerPoint Deck
Chances are that you won’t have a slide deck full of map slides. Instead, it’s more likely that you’ll finish up your map slide in PPT and take it to an existing PowerPoint presentation.
To move your slide to another presentation, start by clicking on the slide thumbnail in PowerPoint’s sidebar. Then, copy it by pressing Ctrl + C on Windows or Cmd + C on Mac.
Now, jump over to the slide deck you want to paste the map into. Right-click in the sidebar in the spot you want to paste your slide into. You’ll see several thumbnails, and you can choose between Use Destination Theme and Keep Source Formatting:
- Use Destination Theme attempts to match your map slide’s style to the deck it’s going into. Typically, you should try this first so that it matches.
- Keep Source Formatting preserves the same style. It also preserves formatting. This will keep it as you initially prepared the presentation.
Check out the quick screencast lesson below to learn more about the options for pasting a slide into a separate presentation:
From this point, you might want to adjust the style so that it matches your presentation. Items to check include:
- Double check that your fonts match. The pasted version of the slide should match the other ones.
- Ensure that your color scheme matches nicely. The default slide deck in this tutorial uses blue-green gradients. You’ll want to adjust this to match the color scheme in your map presentation.
5 Best PowerPoint Map Slide Design Examples
We’ve looked at how to make PowerPoint maps for presentations. We also discussed how to add them to your PowerPoint presentation. But maybe you need a little inspiration. Want to see how maps can be creatively used in any PowerPoint presentation? Study the following examples below:
1. General World Map Slide
This world map slide is a great to use when you need to showcase global data. This slide usually includes a map of the entire world. There are different colored regions. Use them to show different percentages or other figures.


2. Continent Map
If you simply want to show data related to a specific continent or a region, the continent map comes in handy. For example, you can color different states with different colors. Add extra text or points to further explain the data.


3. Country Map
Use a country map in PPT when you want to share details about your services or products on a country level. This is great for local businesses that have branches throughout the country. Use this template to display information about each branch.


4. Maps With Charts
Need to share detailed information about each location on the map? Consider using a slide that pairs a map with a chart. You can see the example in the template below.


5. Map Slides With User Icons
Want to showcase data that relates to a demographic split? Consider pairing a country or region map with user icons. This allows your audience to easily visualize the demographic split. It also facilitates targeted marketing messages.


5 Tips For Successful Interactive Map Presentation Designs
Now that we’ve explored how to insert a world map in PowerPoint, let’s talk about some best practices. Use these tips to ensure your interactive map for PowerPoint is a strong addition:
1. Use Color to Your Advantage
Color is very communicative. Maps are communicative too. It makes a lot of sense to use the two together to communicate ideas.
Look at this interactive map presentation example. Note how the colors are associated with different symbols. You can take this idea and expand upon it in many ways. It’s also a great approach because the association is completely visual. It makes it easy to see correlation.


2. Be Strategic With Your PowerPoint Maps
Your PowerPoint map chart should serve a purpose. It doesn’t have to monopolize the entire slide.
You could have the map as a smaller part of the design, emphasizing an idea. Or, you could have the map as the star of the show. Make it large and let it visually convey data.
The goal with a map is to show geographic data. This could be simple. You could just show a relevant area. Or this could be complex. You could tie regions to data or statistics. Make sure you are clear on your map’s goal, so it doesn’t end up confusing or unnecessary.


3. Use Imagery to Help Further Convey Ideas
Imagery can be a great way to push your map further. For example, check out these fun PowerPoint map chart ideas.
In one of these slides, we see buildings added to the map. This helps visually communicate the subject and the area. In these instances, it’s not about data. It’s more about visually communicating an overall idea for your audience.


4. Make Sure Your Map Communicates Clearly
That said, are you clear on your map’s purpose? Make sure it’s clearly meeting those objectives. This is especially important if you’re working with infographics.
We looked at color as a great way to do this. But there are other ways too. Note these example PowerPoint maps.
You can point directly to locations on your map. Or, you can add other way finding elements, directly on your map. These could be simple aspects to animate in or out in PowerPoint too.


5. There Should Be an Objective
The most important thing to remember is purpose. Your maps for presentations should serve your narrative. Adding a map «just because» could prove to be overwhelming. Use PowerPoint maps for things like:
- visually reinforcing a relevant or target region
- sharing specific data about an area
- directing attention to a specific area
Maps can be a strong infographic element. They can also serve as a communicative design element. Both are great approaches to try.
Find Your Own Great Map Template on Elements
You’re probably not a cartographer. You probably don’t know how to create an interactive map for PowerPoint. And you probably don’t have time to draw maps in PPT from scratch.
The best place for PowerPoint map templates is from Envato Elements. It’s flat rate subscription service built with creatives and freelancers in mind.
For a single monthly fee, you’ve got unlimited downloads to choose from. This spans an incredible variety of categories. That includes graphics, stock photos, and more. Of course, it also includes engaging map presentation templates.


Why use a pre-built template? Talented designers and map experts have already given you the framework.
Add a geographic slide to your deck. Use it to create interactive maps in PowerPoint quickly and easily. You won’t waste your time trying to figure out how to make a map for PowerPoint.
Many of the packs include editable U.S. PowerPoint maps. They also include editable maps of Asia, Europe and the rest of the world.
Choose Top PowerPoint Map Templates
So, is there an easy way how to make a PowerPoint map? Use a pre-built template with pre-drawn maps. This takes the guess work out of how to create a US map in PowerPoint.
Try pre-made PowerPoint US map and world map PowerPoint templates. Here are some of our best PowerPoint map slide templates from Envato Elements. They’ll give you a sense of the templates you’ll get access to when you sign up.
1. Americane : America Region Info Map PowerPoint


Looking to make interactive PowerPoint maps with an editable US PowerPoint map? Or how to make an interactive PowerPoint presentation? Look no further!
This template comes with 59 unique and editable presentation slide designs. You don’t need to know how to create a PowerPoint interactive map for a presentation from scratch. This template saves you loads of time. It provides good visual designs to work into any map presentation.
2. Create Animated Map in PowerPoint


This template comes with 1,000 icon sets. It also has 834 slides in three premade templates. Create animated maps in PowerPoint quickly and easily. Drag and drop images to screen mockups. To top it off, enjoy free update and support! Master how to create an interactive map for PowerPoint today.
3. World Maps for Presentations (PowerPoint Map Chart)


Take the guess work out of how to create a map for PowerPoint with this template. Create an interactive map for presentation PowerPoints and more. Download these maps for presentations and easily customize them in PowerPoint.
4. PowerPoint Maps Presentation (Map in PPT)


This template makes it easy to create an animated map in PowerPoint. Use them to create an interactive map for presentation purposes. Easily insert a map in PowerPoint and use it to convey your ideas.
5. Maps PowerPoint Infographic Slide


Still trying to figure out how to make an interactive PowerPoint map presentation? This template helps you make interactive PowerPoint map in minutes. This template comes with 33 infographic maps for presentations. They are easy to customize.
Common PowerPoint Questions Answered (FAQ)
Thinking about using PowerPoint to create your presentation? Then you might have a few questions on your mind. We’ve gathered some of the most commonly asked questions about PowerPoint. These answers can help you decide if PowerPoint is the right tool for you:
1. Can I Download Microsoft PowerPoint for Free?
You can get access when you buy a subscription to Microsoft Office. While you can’t download it for free, you can use the online version with limited functionality for free. This tutorial explains the differences between the different PowerPoint versions:
2. Can I Add Videos to My Presentations in PowerPoint?
Yes, you can. A video can add interest to your PowerPoint presentation and engage your views. We’ve got a step-by-step tutorial that walks you through the entire process! Here’s some help with adding videos to PowerPoint presentations:
3. Can I Collaborate on My Presentation With PowerPoint?
Yes, this is possible. Recent versions make it easy for multiple people to work on the same presentation. This tutorial explains how:
Sharing your presentation online can expand your audience. Thanks to PowerPoint and SlideShare, you can upload and share your presentation online. Discover how here:
5. What’s the Difference Between PowerPoint Online and Desktop PowerPoint?
PowerPoint Online has somewhat limited functionality when compared to its desktop counterpart. For starters, the printing functionality is limited. The ability to change Views is too. For more differences between the two versions, check out our comparison:
Find More of the Best PowerPoint Map Templates
In this tutorial, we covered how to make a map in PowerPoint. We started with a great-looking template. Then we refined it to match our style.
Looking for a complete guide to learning Microsoft PowerPoint? Make sure to check out the Ultimate Guide to the Best PPT tutorial. Here are other recent tutorials. Why not learn even more presentation skills?
Learn More About Creating a Great PowerPoint Presentation
Creating a memorable PowerPoint presentation isn’t easy. We’ve got plenty of tutorials to help you out. Learn more about creating a great PowerPoint presentation with these tutorials:
Another Great Resource on Presentations: Free eBook Download
In our main tutorial, we’ve looked at how to make a great map in PowerPoint. I want to make sure you know about another great resource we’ve got. Check out our free eBook, The Complete Guide to Making Great Presentations. It’ll teach you how to make a PowerPoint presentation. Why not download your copy today?


We’ve got the perfect complement to this tutorial. Our eBook walks you through the complete presentation process. Subscribe to the Tuts+ Business Newsletter. You’ll get The Complete Guide to Making Great Presentations for free. Discover how to write your PowerPoint presentation. Design it like a pro. Prepare it to present powerfully.
Get Your Editable PowerPoint Map Template Today
You’ve just learned how to create a map in PowerPoint. Need to show various locations or geographic-related data? Maps for presentations make a real difference.
Make PowerPoint maps a part of your next presentation. Try an editable US PowerPoint map template from Envato Elements. Use it to skip ahead in building accurate, stylish maps.
A subscription to Elements unlocks a multitude of high quality PowerPoint map templates. You’ll have access to tons of other creative assets to supplement your presentation. Why not sign up today?
Download your map template and start building your PowerPoint presentation now.
Editorial Note: This tutorial has been updated to include new information—with special help from Barni Rajah, Brenda Barron, Daisy Ein and Sarah Joy. A video has been added by Andrew Childress.
Two techniques to make PowerPoint interactive with a map, diagram, timeline or chart.
At Buffalo 7, we’re always looking for clever ways to make our presentations feel like anything other than PowerPoint. Being able to interact with elements on your slides is more than a cheap trick used to make your audience think you’re some kind of PowerPoint wizard.
Tailoring your presentation to your audience shows you understand their needs and their challenges, but you don’t have time to rewrite your entire presentation before every meeting. By housing all possible avenues in one presentation, but making these elements interactive in PowerPoint with a simple click, you will make every audience feel like they’re your only one.
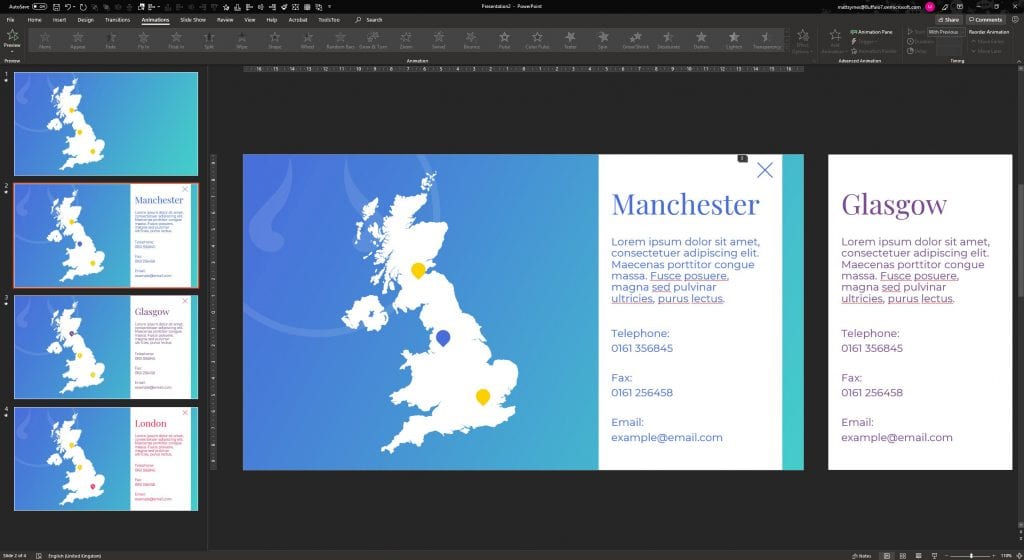
Below, one of our awesome developers, Matt, takes you through two ways you can make an interactive map in PowerPoint, based on your skill level. The example below shows how to add information pop-up boxes to an interactive map. However, these instructions could be applied to a diagram, timeline, or a complicated chart. This method allows you to break these heavy elements down into manageable chunks. Once you have the theory down, the opportunities are limitless.
Building your slide
Regardless of your skill level, the first
step is the same: you need to build your slide.
There are plenty of map designs available to you online, but we use Shutterstock to source many of ours. Depending on your slide background design, it’s probably best to source a map with a transparent background.
Now, place all your location markers in the
relevant places across your map. It’s important to get this slide completely
accurate before you move on. If you find a mistake later, or you just need to
change something seemingly simple, such as the colour of a marker, you will
need to do it across every duplicate slide, so do your checks now.

Once you’re happy with your base slide design, it’s time to duplicate the slide. You will need one additional slide for each location pin. In the left-hand slide view, right click on the base slide and select Duplicate Slide. Continue to duplicate this slide until you have enough for all your locations, then select all the duplicate slides, right click again and select Hide Slide. By hiding these slides, you will only be able to access them when you click on the relevant location pin. This will stop you accidentally clicking through every location when you’re presenting.
Interactive PowerPoint map level one: simple animation
With all duplicated slides still selected,
go to your Transition pane and select Fade. This will create the
appearance of a fade animation on the pop-up box, when you click to reveal it.
Now, select the original base slide and add
any entrance
transitions you may want when first clicking into this slide. If you’re
applying fade transitions throughout your presentation, that’s fine, you can
stick with that here too.
Now to add your location information. Click
into your first hidden duplicate slide. Add a simple shape that you want to
house your location information in. This is our example design, but you’ll want
yours to be consistent with your brand and your slide:

Notice the cross in the top corner of the
box? It’s important for you to have a way to navigate back to your base slide
included in your design. We’ve chosen this web-style cross, but you could have
a back arrow, home button, or just a blank area that the presenter knows to
click to get back. We’ll cover how to add the navigation a little later.
Now, type in all your information for the
first location. This could be contact details, relevant stats, anything you
like. Once you’re happy with the look of this slide, carry out this step for
the remaining hidden duplicate slides, filling each with one location box. You
may also want to change the colour of the specific location marker on each of
these slides, to remind the audience which location you’re talking about.

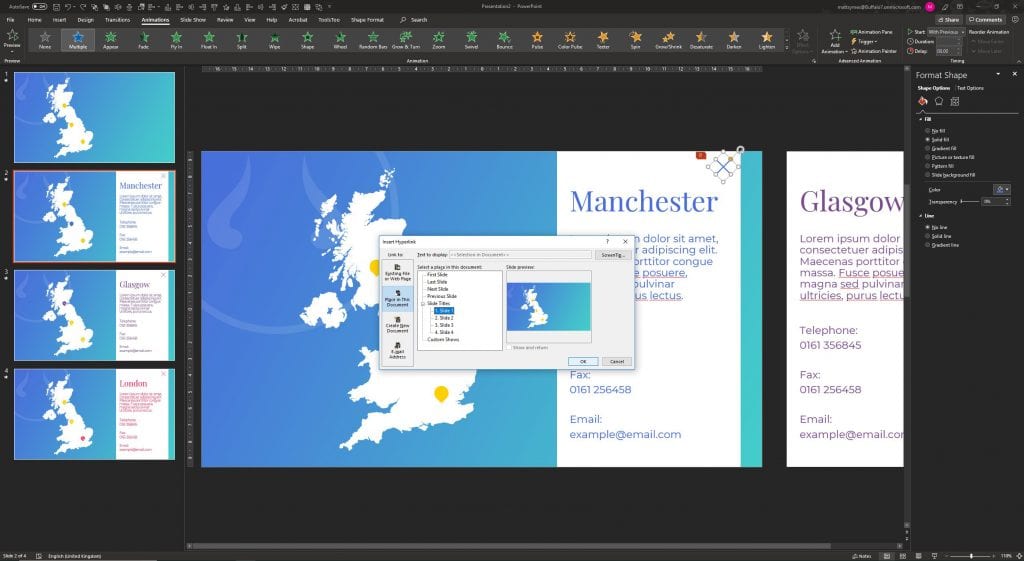
Time to hyperlink. This is such a simple trick and, once you’ve mastered it, this technique opens up a wealth of PowerPoint interactivity possibilities.
Click back to the base slide. Select your
first location marker and right click. If you’re on a PC, select Link
and under Link to:, choose Place in This Document. Then simply
click the slide number of the relevant duplicated slide. If you’re on a Mac,
once you’ve right clicked, you just need to click Hyperlink…, select This
Document, and follow the same steps from here. Now, repeat this step for
every location marker on the original base slide.
From your base slide, click into Slide Show
mode to see your hard work in action. Click on any of your location markers and
magically your location information box will fade on beautifully, without your
audience knowing you’ve actually moved to a different slide.
But, wait. Now you’re stuck on this slide.
Remember I mentioned our backwards navigation? Our final step for this method
is to add our links back to the base slide. Add a hyperlink, in the same way as
above, linking this cross on every duplicated slide back to the base slide.
Now you’re all done!
Level two: feeling confident?
We have shouted about the joys of Morph before, but we just can’t seem to shut up about this versatile PowerPoint transition. Unfortunately, if you’re on a version of the software that’s pre-2016, you may need to point your boss in the direction of our blog to convince them to let you upgrade. If you already have PowerPoint 2016 or later, and you want to create incredibly smooth transitions between your interactive map slides, keep reading.
Build and duplicate your slides the same as
before, but when you select all duplicated slides and navigate to your Transition
pane, you now want to click Morph instead.
Adding your location boxes is where it gets a little fiddly. For Morph to work effectively, you need to add all your location boxes and relevant information to all of the duplicated slides. However, only the box relevant to that slide sits on the slide itself, all the others need to be positioned slightly off the slide. In the example below, we’re on the slide about Manchester, so the other location boxes are stacked one on top of the other (in no particular order) to the right side.
The best way to not confuse Morph is to be
meticulous with your elements. Always copy and paste the boxes from one slide
to another, as this shows Morph that they’re linked, and try to place the boxes
in the same position on every slide, with the exception of the one that needs
to move on the slide itself.
Once you’ve painstakingly placed all your elements, you can follow the instructions from the first method to hyperlink your markers and back buttons in exactly the same way. And you should end up with something like this:
There’s just one more thing to consider
when working with Morph. If you choose to change the marker colours to
highlight the locations, Morph might get a little mixed up and not get all the transitions
right. To prevent this, assign a number to each location marker by typing
directly into the marker shape, like this:

Don’t worry if this isn’t part of your design, we’re going to hide it, so it’s just our little secret. Right click on each marker and click Format Shape. In the side panel, click into Text Options and change the text Transparency to 100% and voilà, they’ve disappeared. Now your markers should stay put when you navigate between location slides.
Make PowerPoint more interactive with a map like this. Learn how to use hyperlinks and hidden slides. This is the key to unlocking another level of PowerPoint. Once you’ve got your head around it, you can start to fake multiple web-style features without having to leave PowerPoint or spend piles of cash working with a web developer. The possibilities are endless, from suggested further reading options that animate in when triggered, additional information pop ups, and hidden menus that appear on click to take you to anywhere within your presentation, your audience won’t have seen anything like this in PowerPoint.
Work Can wait
Put off writing that email just a little longer.
Send your incoming calls to voicemail.
Put your feet up, grab a brew and explore more presentation
insight in the Buffalo 7 Library
Get Reading